 | |
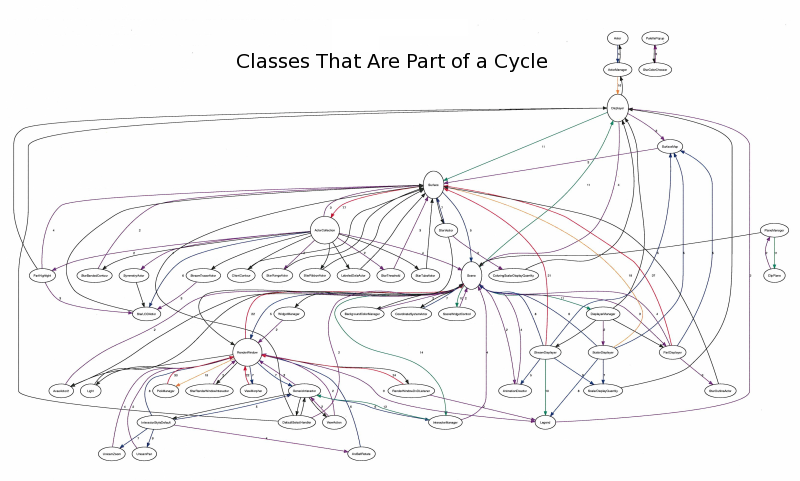
You can note two things about the code base from this graph. First, it is easy to tell which classes are important: just look for the ones with a lot of lines either coming or going. (Above a certain threshold of edges, the node is made twice as high, making it even easier to spot) If you are just starting in a code base, these are classes that are probably the best to look at, since the rest of the code frequently refers to them. The second thing to notice is that it detects cyclic dependencies. (In fact, this was generated with the —only-show-cycles option.) If your code has any cyclic dependencies, it may simply manifest itself in a vague feeling that the code is hard to understand. This utility will reveal the structure of the cycles and make it easier both to understand them and to know where they are occuring so that you can break them.
 | |
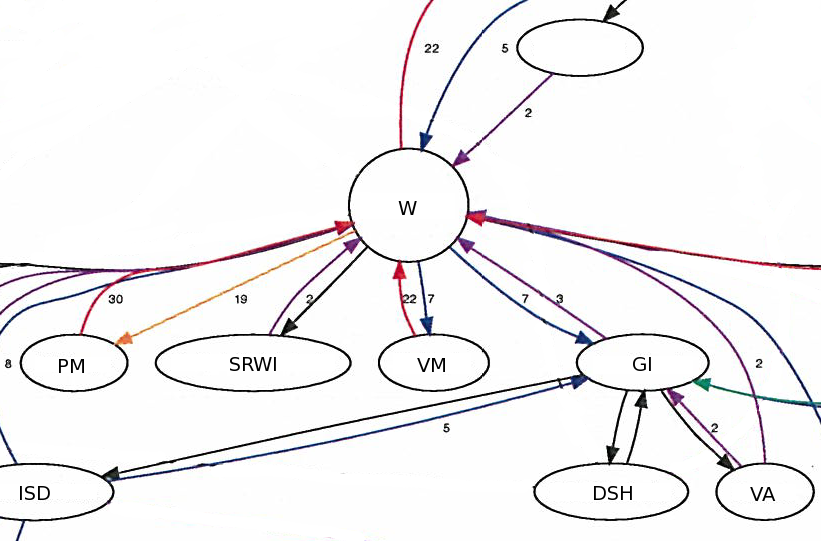
The second image is a zoomed in portion of the original image, and we can see here how easy it is to identify cycles. We can see that W, PM are pretty tightly coupled. If we could reveal the source, we would find that W own a VM. According to the output, W only makes 7 calls to VM, but VM makes 22 calls back to its owner! This suggests that W acts kind of as a global variable for VM. GI, DSH, and VA are a strongly connected graph, so obviously we need understand all three in order to understand any one, with the added complication that there are dependency cycles to W and ISD as well! Obviously this piece of software was very poorly designed, but it might be the case that refactoring is not possible for business reasons; at least now we know the structure. And if a refactoring becomes feasible, it is obvious where to start.
This tool is available as the JavaGraph tool in the CodeFalcon source. For information on building and running, please download the source and read the README.txt file.