
UpTop
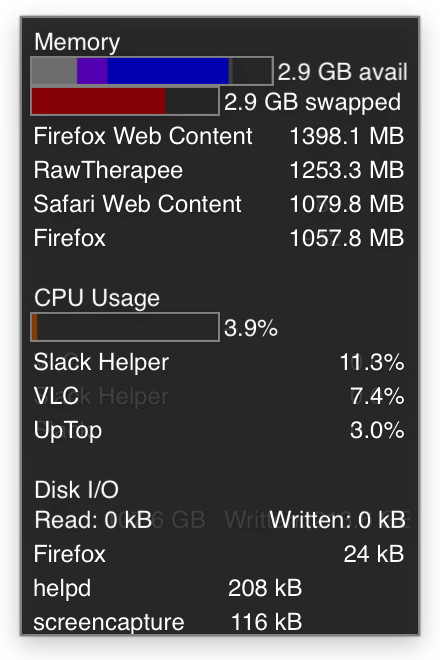 UpTop is a process monitor for macOS designed to the status of memory, CPU, and
disk I/O on your machine, including the processes using the most resources.
The purpose of UpTop to be more condensed than Apple’s Activity Monitor so that
you can keep it running on one of your Spaces (a.k.a. virtual desktops) and
glance at it when necessary. It serves the same purpose as GKrellm does for
Linux. Most settings can be customized in Preferences, although it is not
themeable like GKrellm
UpTop is a process monitor for macOS designed to the status of memory, CPU, and
disk I/O on your machine, including the processes using the most resources.
The purpose of UpTop to be more condensed than Apple’s Activity Monitor so that
you can keep it running on one of your Spaces (a.k.a. virtual desktops) and
glance at it when necessary. It serves the same purpose as GKrellm does for
Linux. Most settings can be customized in Preferences, although it is not
themeable like GKrellmThe process lists are actually scrollable (move the mouse on top of them and scroll), although if you want to examine more processes you will probably want to do View » Show All Processes (Cmd-A). This will open a window with a condensed version of information for all processes.
Values might vary a little from Apple’s values in Activity Monitor. In particular, the amount of memory a process takes up is the “physical footprint.” Documentation for kernel structs is non-existant, so I assume this counts shared libraries for each process, so it might over-estimate the actual amount of memory used. However, this seems like the most useful figure, especially since the other option (“resident size”) frequently reports more memory used than the physical footprint.
The disk I/O figures default to showing the last five ticks’ worth of disk I/O. This is so that processes that write to the disk show up long enough that you can see what they are. You can set it to only accumulate one tick in the Preferences if you do not like this behavior.
Downloads
UpTop binary (macOS 10.8 [Mountain Lion] or later)Source code